
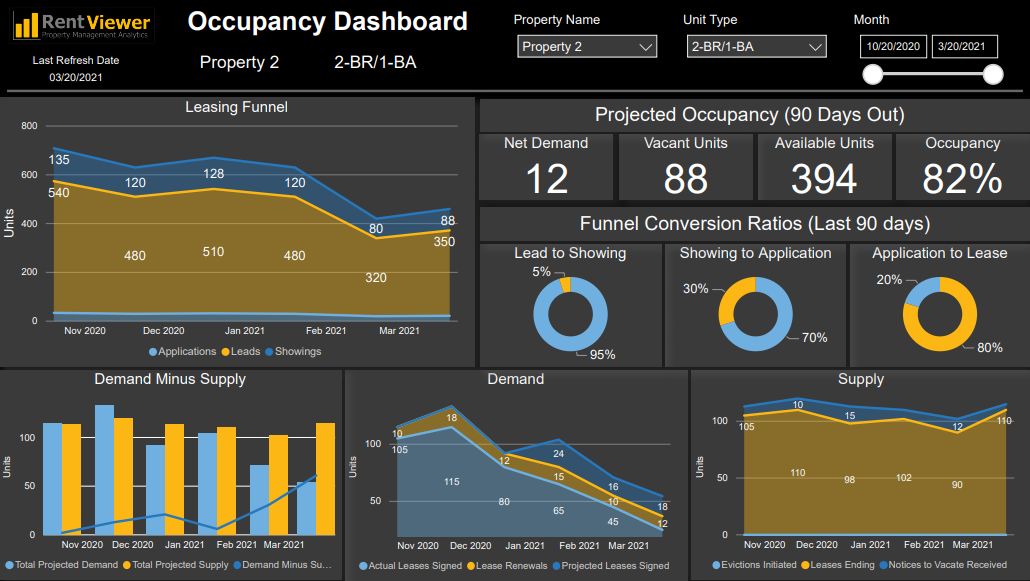
Take a minute to look at the occupancy dashboard image below. It is forecasting occupancy 30, 60 and 90 days from now. The rest of the article describes how to forecast occupancy for your portfolio.
How to Forecast Occupancy
Let’s say you have been given a monthly occupancy target for each of your multifamily properties. And you and your team meet weekly to review if you are on track for achieving the targets.
Which metrics should you be looking at?
Look only at Leading Indicators
If you have read my post on Leading Indicators, you know that looking at current occupancy each week will be useless. Why? Because, in this case, occupancy is telling you history. You want forward looking metrics.
So, what are the occupancy metrics that are forward looking?
Let’s consider both the supply and demand for your units.
Supply is the number of units available to be leased, and demand is the number of units that will be leased, if available. This information is useful when looked at by unit type and month.
Demand-Side Metrics to Forecast Occupancy
For demand, there are two groups of metrics to look at:
Leasing funnel metrics and move-ins
For demand, I want to know these leasing funnel metrics:
- Number of leads
- Number of showings
- Number of lease applications
- Number of leases signed (with move-in dates)
Funnel Conversion Ratios
For each of these funnel stages, I also want to know my conversion ratios.
For example, if I have converted 10 leads into 1 showing, or 5 showings into one signed lease, then I can use these ratios to predict how many signed leases I will have in the coming months. Lets call this “Projected Leases Signed” (as opposed to “Actual Leases Signed”).
The above four will tell me how many new leases I can expect in the next month and beyond.
If you are using Rent Manager or Entrata, the above information can be pulled from the Box Score. Appfolio and Yardi users can also run a report for this.
Move-In Dates
You should be asking your leads about desired move-in dates, and actually recording that information (for example, “… is looking for a 2-BR/1-BA with move-in date between Sep 1 and Sep 15”), then you are in good shape.
Knowing how many showings or applications you have but not knowing the desired move-in dates will not get you too far.
I want to know how many move-ins to expect each month (or even week) by Unit Type. For leases already signed, you can find the counts in your Rent Roll or Move-In / Move-Out report. Make sure to summarize the totals by Unit Type.
Supply Side Metrics to Forecast Occupancy
Now I want to know how many units I will have available in the coming weeks and months.
For this, I want to know the following by move-out date:
- Leases Ending (and not renewing)
- Notices to Vacate Received
- Evictions Initiated
- Unoccupied Units
If you have these metrics at your fingertips, you will know what levers to pull. Being able to recognize, for instance, that three months from now, supply is projected to be far greater than demand is a huge advantage. Knowing this so far in advance gives time to take corrective action.
In a follow up post, I will present a dashboard that can be used for tracking the metrics that predict occupancy.
Compiling the Inputs
Here are the demand and supply inputs for making your forecasts. Assume we are currently in December.

The above table illustrates the supply-demand analysis. The key is to record the move-in date when you engage your leads. And use conversion ratios to translate showings and applications into projected leases.
Free Download
Property Management Metrics Handbook
The Property Management Metrics Handbook contains over 100 metrics for financial and operational performance management. Download your free copy.
