Property Metrics Dashboard
Property Metrics Dashboard Features
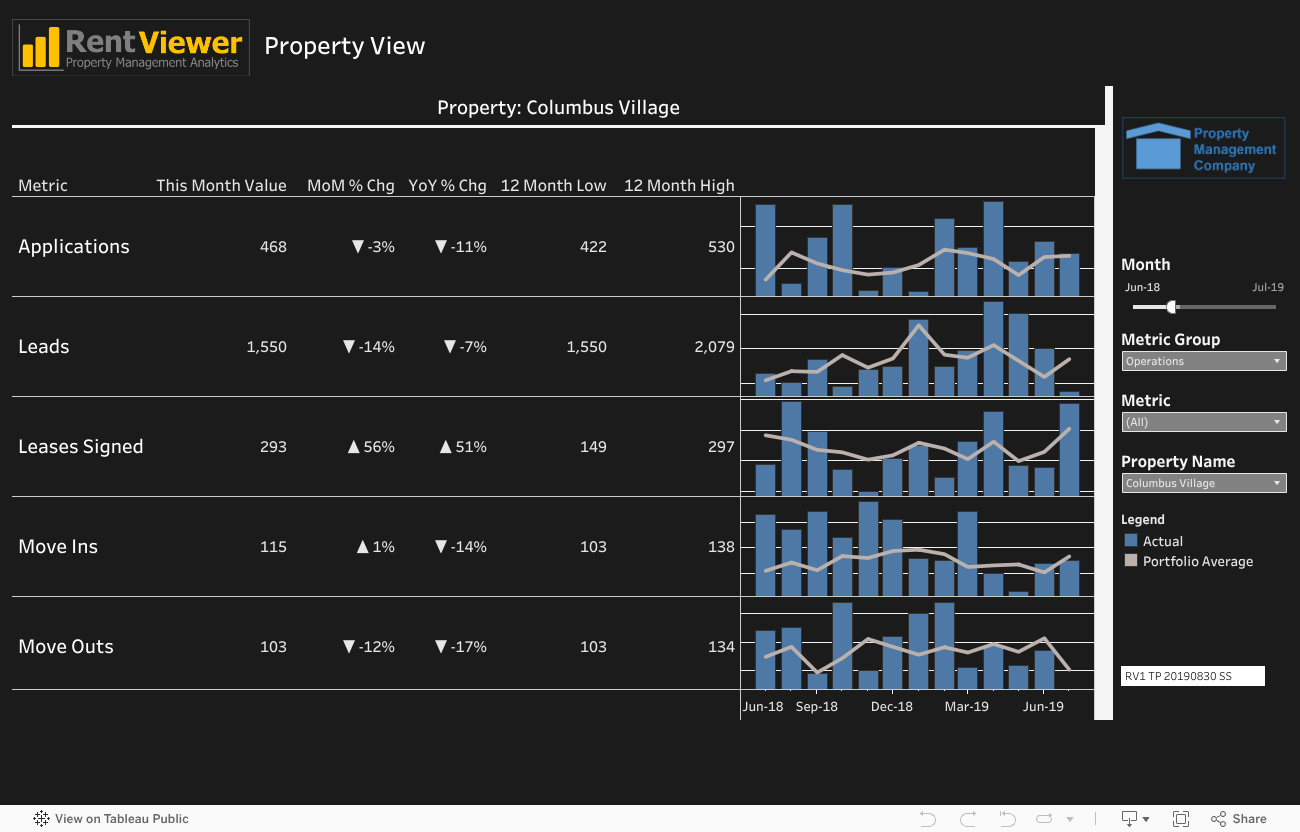
This dashboard is inspired by the simplicity of a stock market chart. It helps companies see a property’s performance in a similar format that a stock chart uses to track stock performance.
The information includes current Month-to-Date Value, Variance to Previous Month, Variance to Same Month Last Year, 12 Month Low, 12 Month High, and a spark-line showing the 12 month trend.
Get an executive level at-a-glance view of over 20 metrics relevant to property operations such as:
- Box Score
- Budget Comparison
- Rental Unit Listing
- Balance Sheet
- Market Rent Analysis
- Move In Move Out
- Aged Receivables
- Filtered Issues
- And more
Questions Answered
- What is my Month-to-Date Value?
- How large is the Variance to last Month? What about the Variance compared to the Same Month Last Year?
- Which month was the 12 Month Low? Which month was the 12 Month High?
- What does the trend for the last 12 months look like?

ID: RV02
Property Management Dashboard Interactive Demo
Have any questions? We’d love to talk to you.
Call 248-601-6400 or Book a FREE meeting with us today!