Portfolio Metrics Dashboard
Portfolio Metrics Dashboard Features
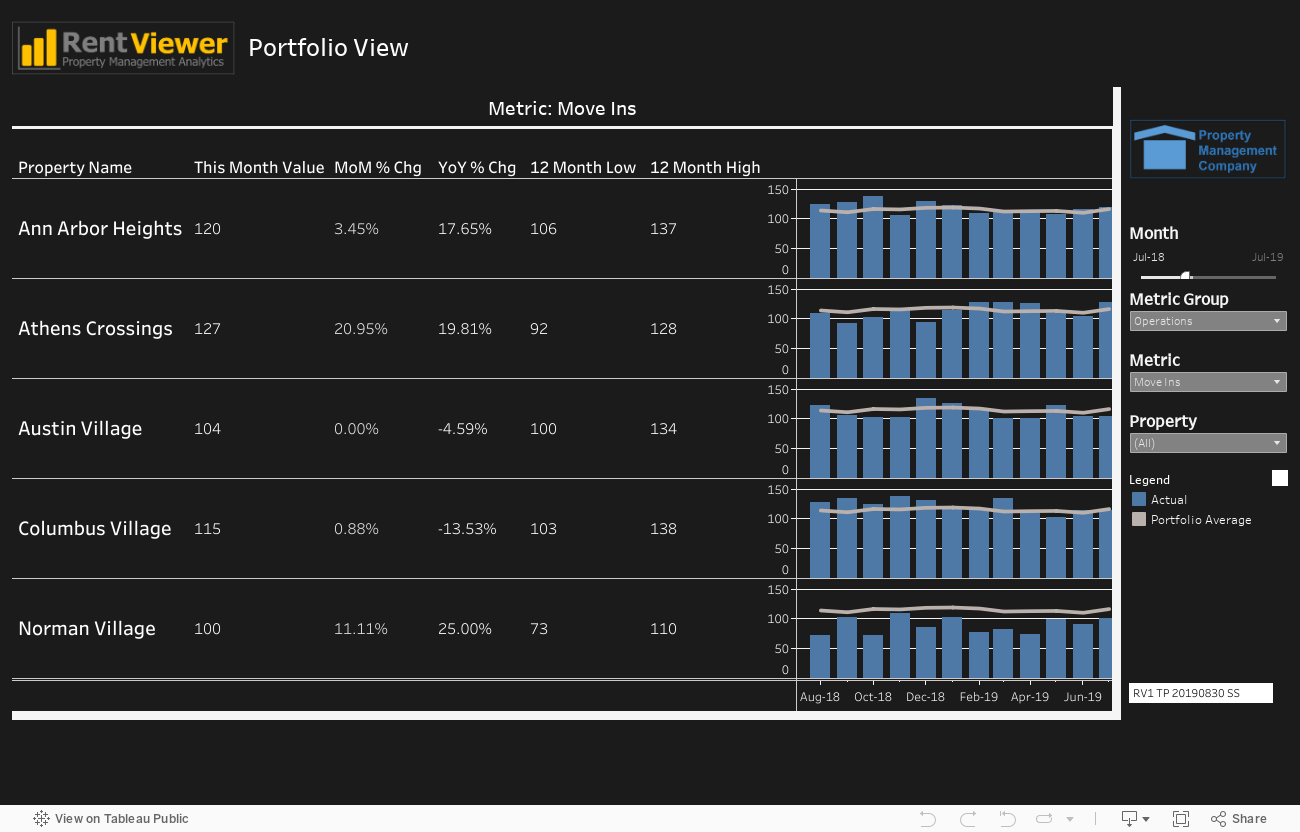
Imagine being able to view the NOI of a group of properties, and see which ones are above or below average. This report gives you that not just for NOI, but for about 30 metrics.
The heading of the report displays the selected metric name. Each row on the chart displays a property’s performance for the selected metric. For each property, the Portfolio Metrics Dashboard includes information such as:
- Current Month Value
- Month over Month % Change
- Year of Year % Change
- Highest Value in Trailing 12 Months
- Lowest Value in Trailing 12 Months
This is all visible in a one-page view of the performance of a group of properties for a selected metric.

ID: RV03
Portfolio Metrics Dashboard Interactive Demo
Have any questions? We’d love to talk to you.
Call 248-601-6400 or Book a FREE meeting with us today!