
See your AppFolio data in dashboards
Tired of manually exporting data and building reports in Excel? We offer pre-built dashboard packs and fully custom AppFolio dashboards.
Stop manually exporting data
RentViewer builds dashboards and data warehouses for companies that use AppFolio — sourced from 20+ popular data sets. No need to manually export data.
A pack of 5 pre-built dashboards is available for $250/month*, in Multifamily, Manufactured Housing, and Third-Party Management editions. (*Setup charge depends on plan; Power BI licenses are extra.)
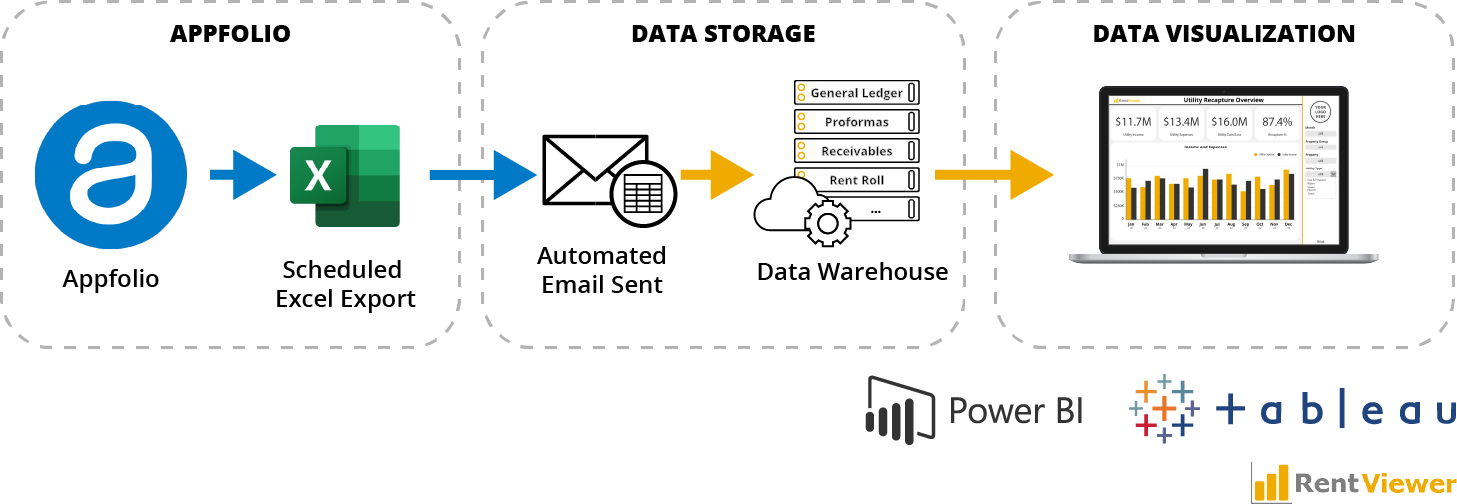
We connect to 20+ popular AppFolio data sets, including:
Here is How it Looks on Your Computer
Examples of the pre-built dashboards included in the RentViewer subscription. Click any to expand. Extensive customizations are possible.
Getting to your AppFolio data
Build with the AppFolio API
If your AppFolio subscription includes the API (available above certain unit thresholds), we build your dashboards directly against it for live, automated data.
Keep it fresh without an API
No API? We've got you covered. We set up scheduled reports within AppFolio that export to a dedicated inbox, then refresh your Power BI dashboards from those exports automatically.
Pre-built Command Center packs
Start fast with curated dashboard packs in our Command Center — sample visuals across leasing, financials, and operations.
Custom analytics projects
From Rent Roll analytics to a leasing-velocity study (analyzing Guest Card move-in dates and bedroom demand against move in / move out supply), we build to your exact need.
Most dashboards here are built in Power BI; we also use Tableau or Looker on request. Want a hands-on look? Watch our demo videos.
Ready to visualize your AppFolio data?
Call us or book a meeting and we'll walk through the right approach for your portfolio.